Custom Reports
The Custom Reports feature allows you to create report
templates based on any combination of criteria, with many formatting options.
Formatting
options include headings, columns, sorting, and color graphs. Single
and two-level metrics based on any fields can be included. Report
output can be exported to another application (such as Excel) and can
be scheduled to be run on a regular basis.
Report Options
The names of many of the fields in FootPrints
can be changed by the administrator (Title,
Priority,
Status,
Description,
etc.), as well as the name of the records (Issue). Custom
fields can also be created. For
clarity, this manual always refers to FootPrints records as “Issues”
and uses the default terms for the other field names.
To create a custom
report, select  Reports
| Custom from the FootPrints Toolbar. The Custom Report Wizard is displayed:
Reports
| Custom from the FootPrints Toolbar. The Custom Report Wizard is displayed:
- Step
1: Style—Select
the output style of the report. Choices are:
- Columns—Issue data is displayed in fixed columns.
One Issue is displayed per row. Columns can be selected from any available
fields.
- Wrapped—Each
Issue returned is displayed in its own mini-table. Line breaks can be
used to wrap data to multiple rows, for example, to place the Description
in its own row. This style is useful for printing reports that
contain many fields.
- Metrics and Graphics—Create custom metrics and graphs of counts,
averages and sums on any field. Single and two-level metrics are supported.
Output options include table, bar, and pie charts.
- Export—Export data to atext file that
can be saved to your local desktop. Use this format to import FootPrints
data into a spreadsheet or other programs
- Include metrics...—Column and
Wrapped reports can also contain metric charts and graphs. Check this
box to include metrics in a Column or Wrapped report (not available for
Export option).
- Click
 GO to display the
rest of the report options. The steps
on the next page depend on the report style selected in Step 1.
GO to display the
rest of the report options. The steps
on the next page depend on the report style selected in Step 1.
- Step 2: Heading—Define what
is included in the heading at the top of the report output. Available
for all styles except Export. Options include:
- Title—This is displayed
at the top of the report.
- Date—The date the
report is run (updates each time the report template is re-run).
- Time—The time the
report is run (updates each time the report template is re-run).
- Project
name—The
name of the Project.
- Logo
graphic—The
logo image displayed in the current Project.
- There are two possible steps 3. One if for column and wrapped reports and the other is for metric reports and combo reports.
- Step 3: Fields Displayed—Select the
columns to display in the report. All fields are available. This option
is available for all styles except Metrics. For example, to display Title:
- For Type
of Field, choose FootPrints
Fields.
- Highlight Title under Fields.
- Click Add
Field. Title
now is added to the Selected
Fields box.
- History—The History
field is a special field that includes the Issue history in the report.
This provides
an audit trail in reporting. Because
this type of report searches every record of every change to the Issues
that are being reported, using this field can cause a slowdown in the
reporting.
- Re-order—To change the
order of fields to be displayed, highlight a field in the Selected
Fields box and click the up or down arrow to move it.
- Line
Break—Insert
a line break (Wrapped style only).
- Description—Choose which
descriptions to include in the report and when to wrap the data (only
applies if Description
is included in the Selected
Fields box). You
can include the original, newest, two most recent, or three most recent
descriptions in your report.
An Original
Description option is not available for the FootPrints
database.
- Assignees—If Assignees
is selected, the full names of the assignees are displayed in the report
(e.g., Bob
Smith). This is not suitable for importing the report output
into another Project, as user ID’s must be specified in a data import
file. To create a file that includes assignees user IDs (e.g., Bob
Smith), use the System Administration Export
Project Data option.
- Metrics
and Graphics—Create custom metrics and graphs of counts,
averages, and sums on any field. The option is available for Metric style,
and for Column and Wrapped style if the Combo checkbox is checked.
This section only determines which fields
to display; it does not determine the selection criteria for the report.
The criteria are chosen later in the report.
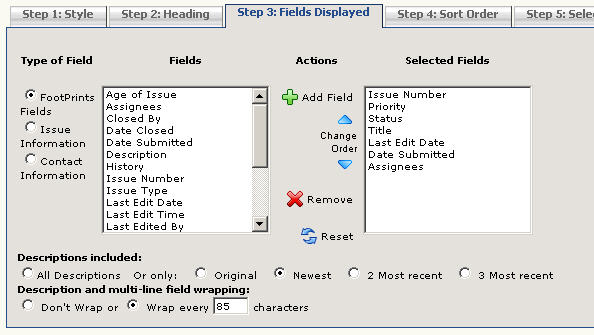
Select the columns to be displayed in the report
- There are two possible Step 4. The first is for reports to be displayed in the FootPrints interface and the second is for reports that are to be exported to a file.
- Step 4: Sort Order—Define
how Issues are sorted in the report output. This option is available
for all styles except Metrics. The
default
is by Issue number in ascending order (from lowest to highest).
Optionally sort on up to any three fields, ascending or descending.
Issues are sub-sorted within each field based on the sort order. Clicking
the Heading
box separates Issues into groups with the field name as header.
For example, if sorting by Status
with Heading
checked, all Open Issues are grouped under the heading Open,
Closed Issues are grouped under the heading Closed,
etc.
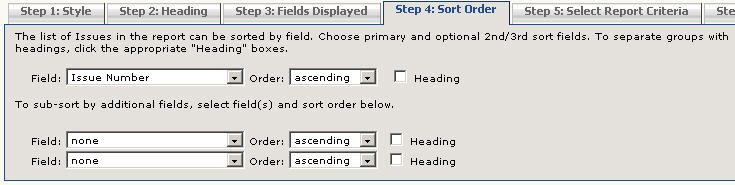
Sort the Issues in the report on up
to 3 fields
- Step 4: Text
File Format—Select
the format for text file output. This only applies to Export style. Choices
are comma-delimited file (.csv), tab delimited (.tsv), or your custom
delimited (.txt)..
- Step 5: Select
Report Criteria—With metric reports, this is Step 4. Choose
the criteria for the report. Only
select the criteria you want to search on. The FootPrints Advanced
Reporting criteria section uses the same mechanism as the Advanced
Search. Refer to section above on
for detailed explanation of criteria.
It is important to understand the meaning of relative periods
and aging in order to obtain accurate information, especially as the searching
and reporting functions of FootPrints
rely on the same types of criteria. If
a search is requested on Issues for "the previous three months,"
and the date is the 15th of May, then the period searched or reported
on will be from February 15th through May 14th, inclusive. That
is, the report or search will exclude the current date and give the three
month period prior to the current date. This
is to ensure that reports and searches yield consistent results. If
reports and searches included the current date, then the results might
differ depending on the time of day at which the search or report was
performed.
- Step 6: Run
Report—Click
GO to run the
report. To save the report, enter a name before you run it. Choose
Personal
to save the report for yourself. Choose Shared/Internal
to share your report template with other internal FootPrints users.
Shared/Public
reports are available to all users including customers (the report only
contains data the user is allowed to see). Shared/Public
reports appear on the customer Pre-Defined
Reports page. Each time a saved report template is run, it
returns the latest matching data.
Saving the report here only saves the report formatting options
and criteria chosen in this form, notthe results of the report. This feature can be used to run the
same report in the future, for example, once a week. Each time the
report is run, it returns the latest data from the current Project.
Saving report output is covered in the topic on .
After clicking GO,
the report is displayed in a separate browser window. Large reports
sometimes take a few minutes to run. To view the details of an Issue,
click the Issue number (or whatever field is in the first column) in the
report. This displays the Details page for that Issue in the main
FootPrints frame.
The report can be saved or printed from the browser window.
If the Export style was selected,
a Save
As dialog box is displayed. Save and name the report to your
local hard drive.
Reports can be restricted based on a user's .
Custom Reports may not be available or some options may not appear if
your role does not allow access. Please
consult your FootPrints administrator
for more information.
 .
Custom Reports may not be available or some options may not appear if
your role does not allow access. Please
consult your FootPrints administrator
for more information.
.
Custom Reports may not be available or some options may not appear if
your role does not allow access. Please
consult your FootPrints administrator
for more information.